A lasso regression analysis was conducted to identify a subset of variables from a pool of 6 quantitative predictor variables that best predicted a quantitative response variable measuring the number of people employed. Quantitative predictor variables include Gross National Product (GNP), GNP implicit price deflator (1954=100), number of unemployed, number of people in the armed forces, ‘noninstitutionalized’ population ≥ 14 years of age, and the year (time).
Because of the small size of the data set (N=16), data were not split into training and test sets.
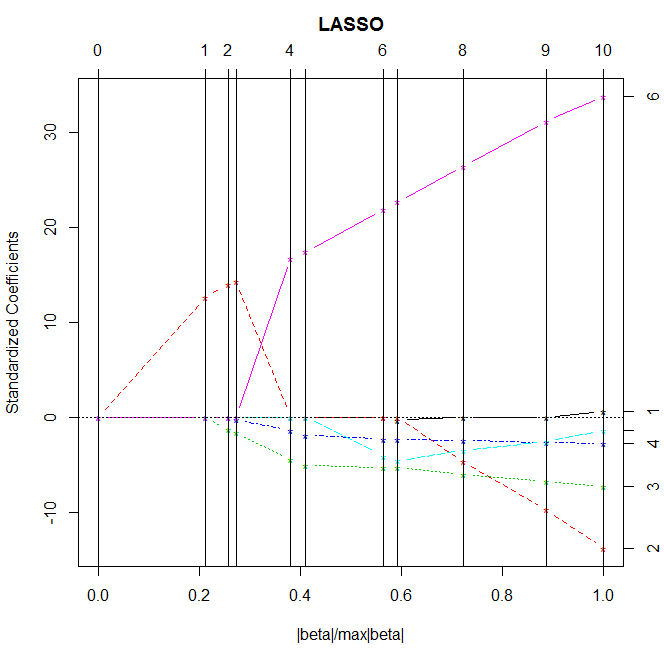
Of the 6 predictor variables, only 2 were retained in the selected model. During the estimation process, year and GNP were most strongly associated with number of people employed. The final model accounted for 97.4% of the variance in the response variable.
Figure 1. Change in the coefficients at each step
Source code in F#:
#load "packages/FsLab/FsLab.fsx"

open RDotNet
open RProvider
open RProvider.lars
open RProvider.datasets
open RProvider.graphics
open Deedle

let longley : Frame<int, string> = R.longley.GetValue()
let longY = longley?Employed
let longX = R.as_matrix(longley.Columns.[ ["GNP.deflator"; "GNP"; "Unemployed"; "Armed.Forces"; "Population"; "Year"] ])
let fit = R.lars(x=longX, y=longY)
R.summary fit
R.plot fit
Which created the following output:
Call:
lars::lars(x = fsr_9628_42, y = fsr_9628_43)
R-squared: 0.995
Sequence of LASSO moves:
     GNP Unemployed Armed.Forces Year GNP Population GNP.deflator GNP GNP.deflator GNP.deflator
Var    2          3            4    6  -2          5            1   2           -1            1
Step   1          2            3    4   5          6            7   8            9           10

LARS/LASSO
Call: lars::lars(x = fsr_9628_42, y = fsr_9628_43)
   Df     Rss        Cp
0   1 185.009 1976.7120
1   2   6.642   59.4712
2   3   3.883   31.7832
3   4   3.468   29.3165
4   5   1.563   10.8183
5   4   1.339    6.4068
6   5   1.024    5.0186
7   6   0.998    6.7388
8   7   0.907    7.7615
9   6   0.847    5.1128
10  7   0.836    7.0000