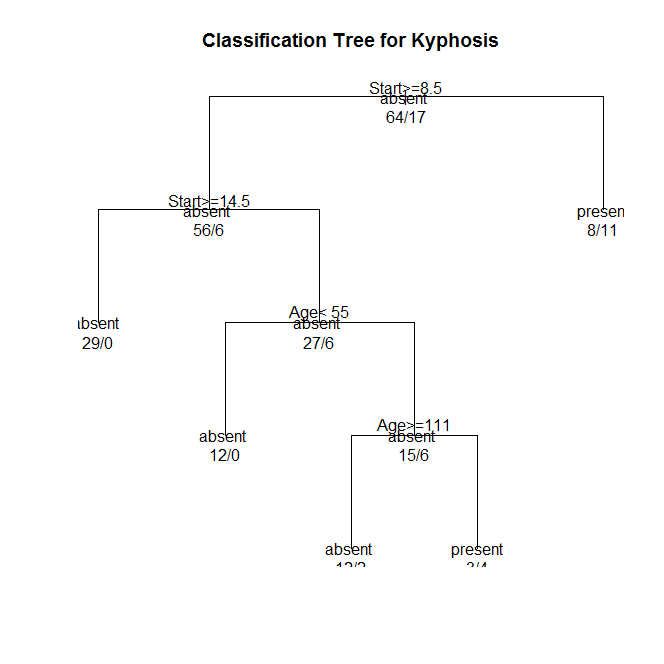
Figure 1. Classification tree (N=81) to predict a type of deformation (kyphosis) after surgery (target variable)
Decision tree analysis was performed to test nonlinear relationships among a series of explanatory variables and a binary, categorical response variable. All possible separations (categorical) or cut points (quantitative) are tested. For the present analyses, the entropy “goodness of split” criterion was used to grow the tree and a cost complexity algorithm was used for pruning the full tree into a final subtree.
The following explanatory variables were included as possible contributors to a classification tree model evaluating after surgery deformation (kyphosis) (my response variable), age in months (Age), number of vertebrae involved (Number), and the highest vertebrae operated on (Start).
The Start variable was the first variable to separate the sample into two subgroups. Patients with a Start value less than 8.5 were more likely to have received kyphosis compared to patients not meeting this cutoff (57.9% vs. 9.7%).
Of the patients with Start value less than 8.5, a further subdivision was made with the Start variable. Patients with a Start value greater than or equal to 14.5 were less likely to have experienced kyphosis. Patients with a Start value less than 14.5 were more likely to have experienced kyphosis. The total model classified 84% of the sample correctly, 88% of kyphosis-affected (sensitivity) and 83% of non-affected (specificity).
Source code in F#:
#I "../packages/RProvider.1.1.15"
#load @"..\packages\RProvider.1.1.15\RProvider.fsx"

open RDotNet
open RProvider
open RProvider.graphics
open RProvider.rpart

let kypho = R.kyphosis.AsDataFrame()
let fit = R.rpart(formula="Kyphosis ~ Age + Number + Start", method="class", data=kypho)
namedParams [ "x", box fit; "uniform", box true; "main", box "Classification Tree for Kyphosis" ] |> R.plot
namedParams [ "x", box fit; "use.n", box true; "all", box true; "cex", box 0.8 ] |> R.text